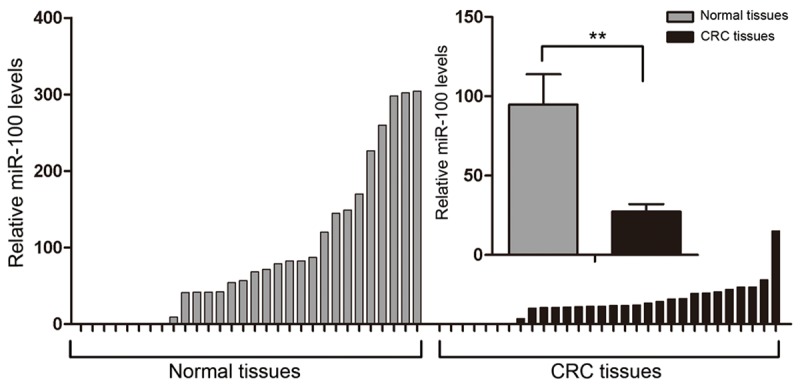
Figure 3.

Different expression of miR-100 in CRC tissues compared with matched noncancerous colorectal tissues. Quantitative real-time PCR was performed to compare the expression of miR-100 between 30 CRC tissues and matched noncancerous colorectal tissues. U6 RNA was used as an internal control. The mean ΔCt of miR-100 in the 30 CRC tissues was compared with that in the matched noncancerous colorectal tissues (**P < 0.01). The mean and standard deviation of expression levels relative to U6 expression levels are shown and normalized to the expression in the normal tissue of each matched pair.
