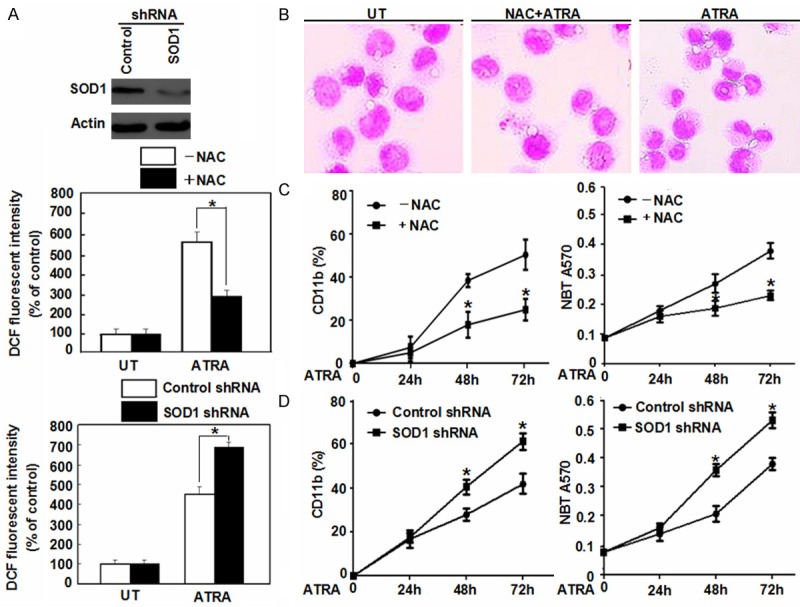
Figure 1.

Effects of ROS on the differentiation of NB4 cells. A. NB4 cells were pretreated NAC (2 mM) or SOD1 RNAi and then ATRA (1 μM) for 72 h. ROS production was assessed by measuring the fluorescent intensity of DCF on a fluorescence plate reader. The incremental production of ROS was expressed as a percentage of control. *P < 0.05 (n = 4, Student’s t-test). UT, untreated group. B. Morphological features of NB4 cells as indicated after a 72 h ATRA (1 μM) treatment with or without NAC (2 mM) pretreatment by Wright-Giemsa stain (100 × magnification). C. NB4 cells were treated with ATRA (1 μM) for 24-72 h with or without NAC (2 mM) pretreatment. And then the cell differentiation was observed by CD11b expression and NBT reduction. *P < 0.05 (n = 3, Student’s t-test). D. After a 48 h transfection with SOD1 shRNA, the cells were treated with ATRA (1 μM) for 24-72 h. And then cell differentiation was observed by CD11b expression and NBT reduction. *P < 0.05 (n = 3, Student’s t-test).
