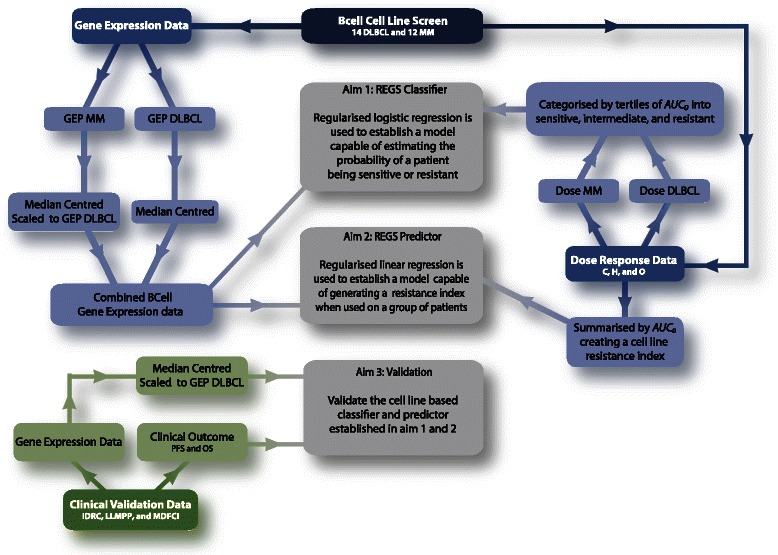
Figure 1.

Flow diagram of the analysis strategy. The blue and green boxes indicate in vitro and in vivo data, respectively. The grey boxes indicate the aims of the statistical analysis. First, test the level of resistance towards the three drugs C, H, and O successively on B-cell cancer cell lines by dose response experiments in accordance with [19]. Secondly, obtain baseline gene expression data for each cell line before treatment. Thirdly, establish a REGS classifier capable of estimating the probability of a tumour sample being sensitive or resistant. This was done by grouping the third most sensitive and third most resistant cell lines for each drug and establishing a REGS classifier by regularised logistic regression. Fourth, establish a REGS predictor based on the sensitivity level of each cell line without grouping them into sensitive and resistant. This was done by using the estimated drug specific resistance for each cell line and establishing a REGS predictor by regularised linear regression. Such a REGS predictor is unable to estimate the probability of a tumour sample being sensitive or resistant; however, the statistical analysis may gain power by using all cell lines without categorising them. Fifth, combine the developed REGSs into a classifier and predictor for CHO. Finally, sixth, validate the established REGSs in independent clinical cohorts.
