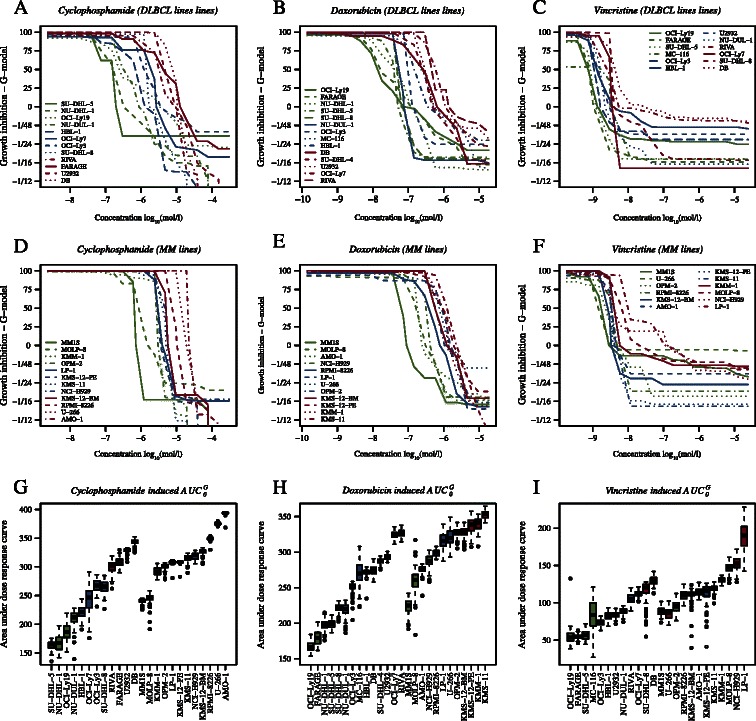
Figure 2.

Dose response curves for the CHO screen. In panels A and D dose response curves are shown for the 12 DLBCL and 12 MM cell lines treated with C. In panels B and E dose response curves are shown for the 14 DLBCL and 12 MM cell lines treated with H. The dose response curves for 12 DLBCL and 12 MM cell lines treated with O are shown in panels C and F, respectively. Finally, panels G, H, and I show bootstrapped AUC0 values for C, H, and O, respectively. The colours represent the categorisation of the cell lines into tertiles where green, blue, and red denote sensitive, intermediate, and resistant, respectively.
