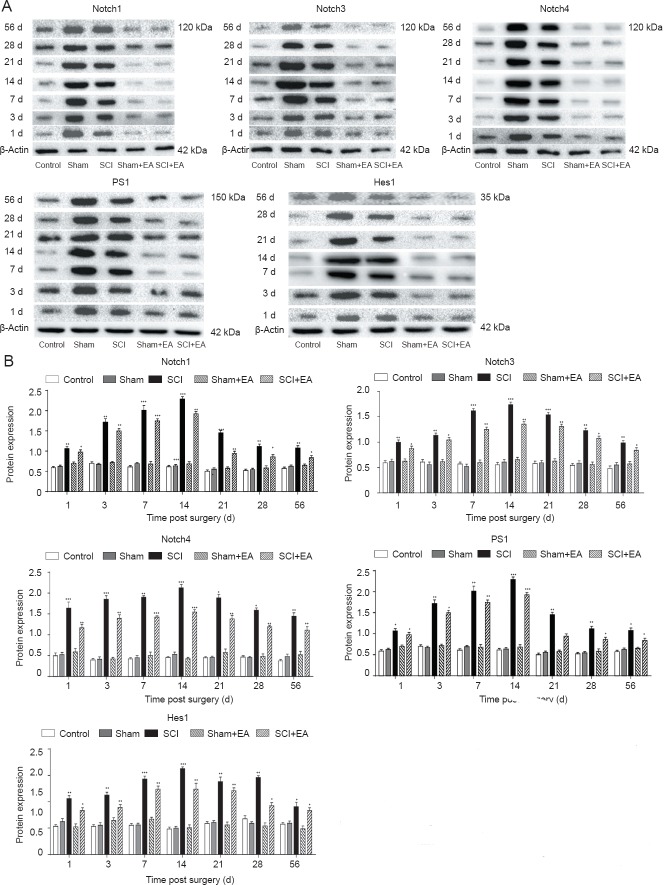
Figure 4.
Effect of EA on changes in protein expressions of Notch signaling pathway-related factors Notch1, Notch3, Notch4, PS1 and Hes1.
(A) Western blotting bands for Notch1, Notch3, Notch4, PS1 and Hes1 in different groups. (B) Quantification of protein expression of Notch1, Notch3, Notch4, PS1 and Hes1. Y-axis indicates the relative optical density of protein bands (the ratio of target grayscale values to loading control grayscale values). *P < 0.05, **P < 0.01, ***P < 0.001, vs. control group. Data are expressed as the mean ± SD (n = 3; one-way analysis of variance and Tukey's post hoc test). The experiment was repeated in triplicate. SCI: Spinal cord injury; EA: electroacupuncture; d: day(s).

