
Figure 3.
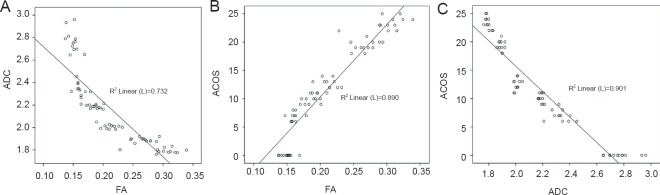
Correlation between diffusion tensor imaging and hindlimb function scores in a rat model of spinal cord transection (Pearson correlation analysis).
(A) Fractional anisotropy (FA) value was negatively correlated with the apparent diffusion coefficient (ADC) value, and the correlation was linear (r = –0.856, P < 0.01). (B) FA values were positively correlated with the average combined score (ACOS) values and the correlation was linear (r = 0.943, P < 0.01). (C) ADC values had a negative and linear correlation with ACOS (r = –0.949, P < 0.01).