Figure 2.

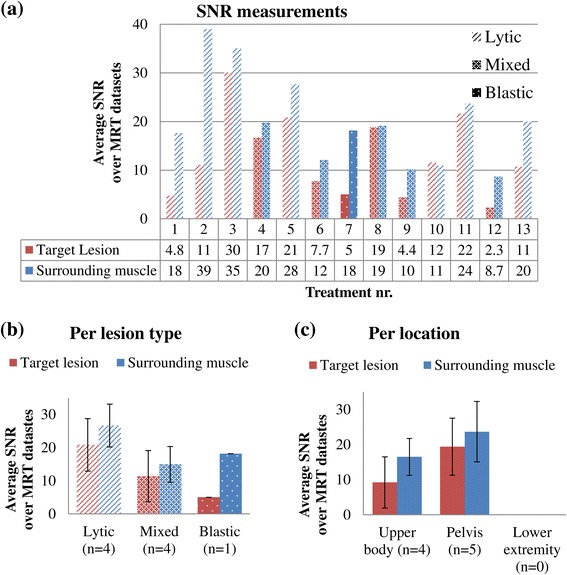
The SNR measured in the magnitude images. The average SNR is shown per treatment (a), per lesion type (b), and per location (c). The rows with numbers below the graph in (a) show from top to bottom: treatment numbers, average SNR values in the target lesion, and average SNR values in the surrounding muscle. Treatment numbers 1, 2, 9, and 10 were excluded in (b) and (c). The error bars in (b) and (c) represent the standard deviations.
