
Figure 3.
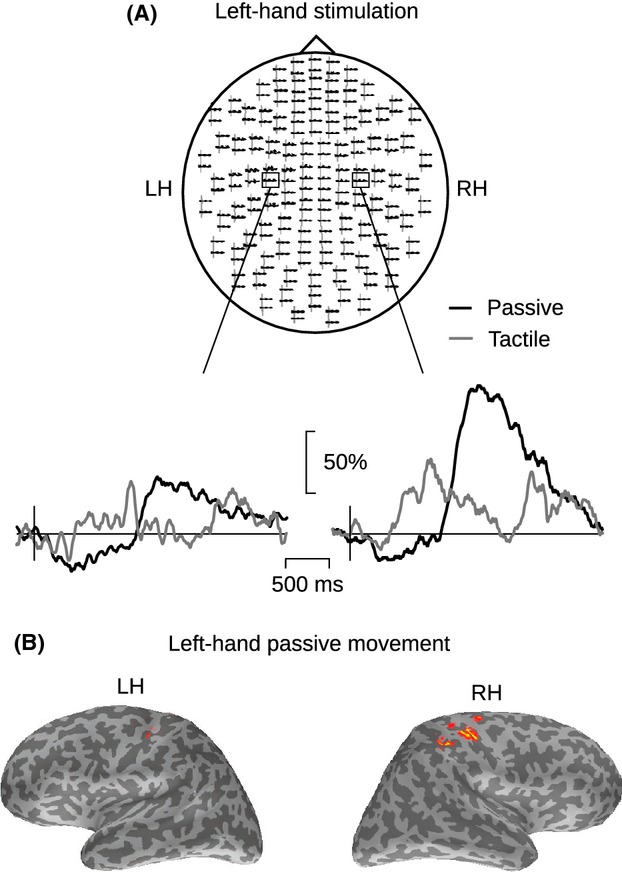
Temporal–spectral evolution (TSE) of the ∽20-Hz rhythm in one subject. (A) Sensor-level TSE of the 15–25-Hz activity to passive movement (black line) and tactile stimulation (gray line) of left index finger in one representative subject (S12). The insets show the responses at two planar gradiometer channels. LH, left; RH, right hemisphere. The amplitude scale (vertical) is relative to the baseline level. (B) The cortical source locations (estimated with MNE, see Methods) of the ∽20-Hz modulation in response to left-hand passive movement. The latency of the MNE maps correspond to the strongest rebound, and each cortical surface view was independently thresholded at 60% of its maximum amplitude.