
Figure 4.
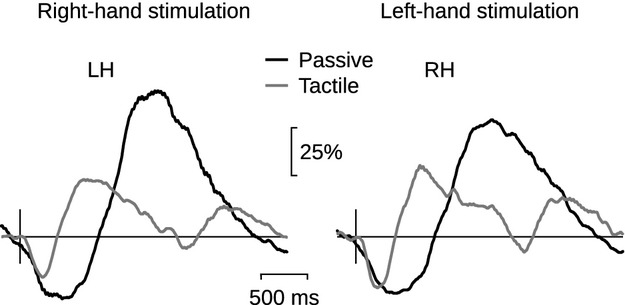
Group-level TSE of the 20-Hz rhythm. Grand average (N = 22) of TSE of the 20-Hz rhythm to passive movement (black line) and to tactile stimulation (gray line) of right and left index finger, in the contralateral left (LH) and right (RH) hemispheres. The amplitude scale (vertical) is relative to the baseline level.