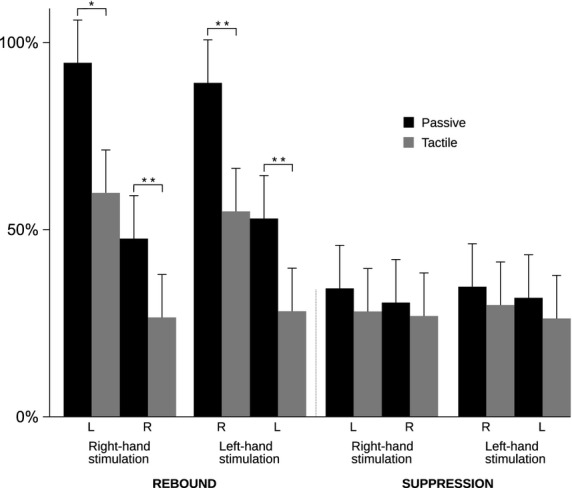
Figure 5.

Rebound and suppression magnitudes. Relative (± SEM) strength (%) of the rebound and suppression to right- and left-hand passive movement (black bars) and tactile stimulation (gray bars). *p < 0.05, **p < 0.01. LH = left hemisphere, RH = right hemisphere.
