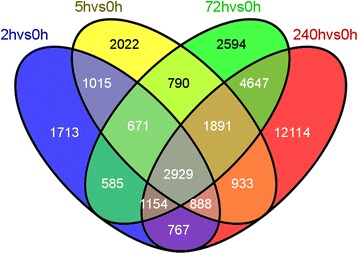
Figure 4.

Differential expression between each pair of samples. Venn diagram showing unique and shared genes between time points. Overlapping examinations were performed based on the resulting gene lists from four comparisons by VENNY [74]. Overlap among four groups, 2 vs 0 h (blue), 5 vs 0 h (yellow), 7 vs 0 h (green), and 240 vs 0 h (red) are shown.
