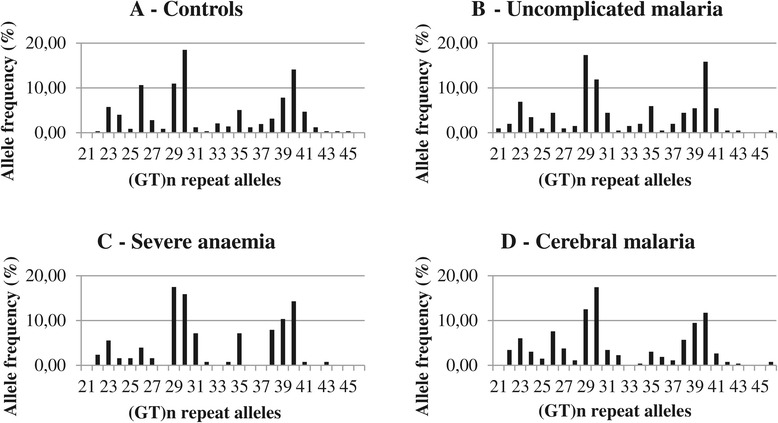
Figure 1.

Frequency distribution of the (GT)n repeats in the study groups. Frequency distribution of the (GT)n repeat alleles in the four study groups.1A: The control group. 1B: The uncomplicated malaria group. 1C: The severe anaemia group. 1D: The cerebral malaria group.
