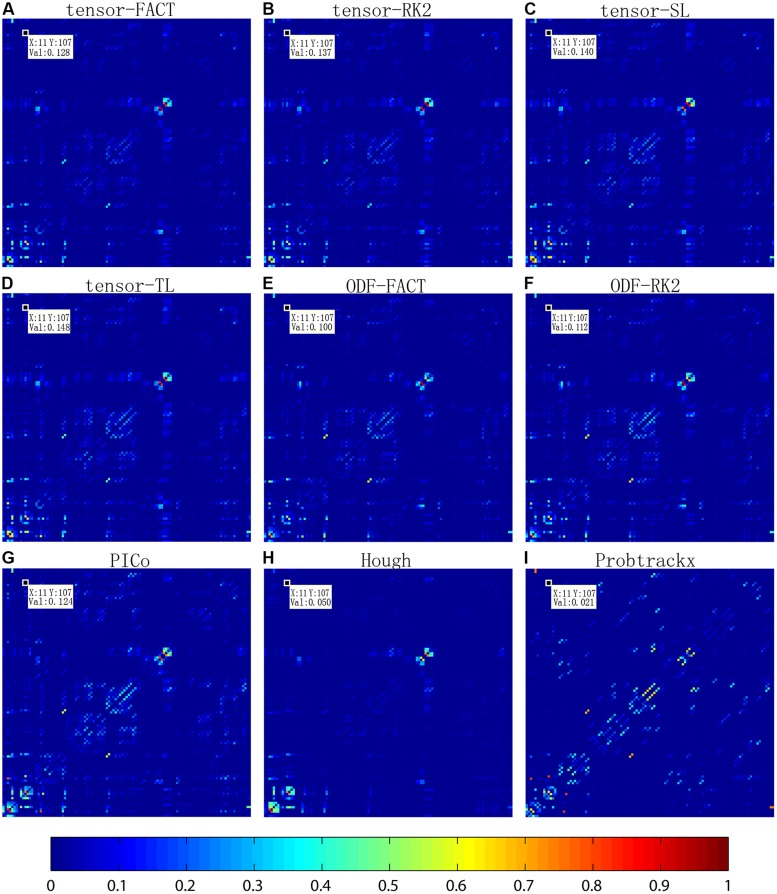
FIGURE 2.
Comparison of averaged normalized brain networks from nine different tractography algorithms, including (A) tensor-based FACT; (B) tensor-based RK2; (C) tensor-based SL; (D) tensor-based TL; (E) ODF-based FACT; (F) ODF-based RK2; (G) ODF-based PICo; (H) ODF-based Hough, and (I) Ball-and-stick model based Probtrackx, from all 202 subjects. In each network, each cell represents the connectivity between each pair of ROIs; the ROI index runs from 1 to 113 from left to right and from bottom to top. ROI names are detailed in the Supplement. Visually, brain networks from different tractography algorithms may have similar patterns but in reality, the recovered brain network varies, as shown by the value in the randomly selected cell (11,107).

