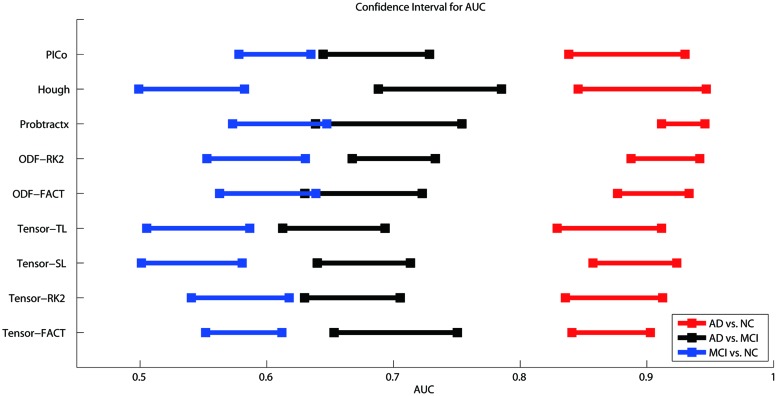
FIGURE 3.
Ninety five percent confidence intervals (CI) for the AUC (classification accuracy) for three diagnostic tasks represented by the three color bars (blue, black, and red) for nine tractography algorithms. The red color means the AD vs. NC classification task, black colors denote AD vs. MCI, and blue colors indicate MCI vs. NC. The y-axis indicates the tractography algorithms and x-axis shows the AUC value. In theory, the higher the AUC value, the better the classification performance. However, if the CI of AUCs has some overlap, we cannot conclude that one algorithm is better than the others, even if the mean AUCs are numerically different. As is evident from the three color bars’ horizontal positions, some classifications are more difficult: AD v. NC is the easiest, and MCI v. NC is the most difficult, perhaps in line with expectation.

