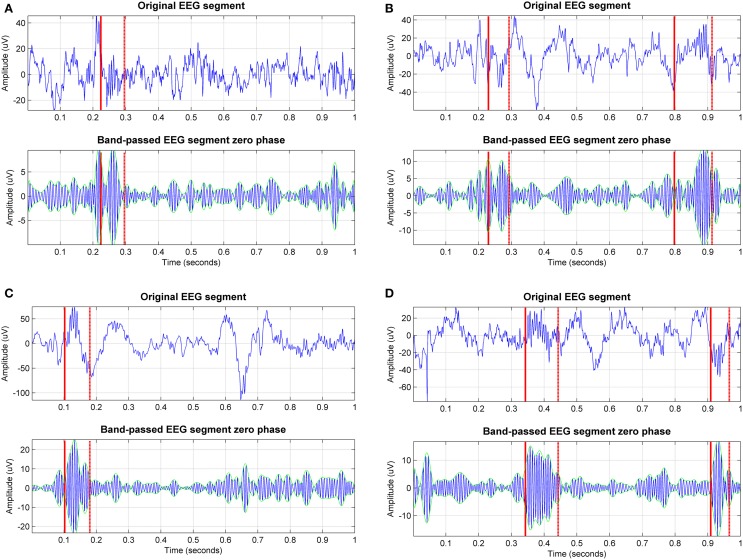
Figure 1.
Exemplary sleep spindles annotated by one of the experts for one of the EEG signals in the DREAMS sleep spindles database (the sampling frequency of the signal is 100 Hz). We can visually appreciate the wide variability of sleep spindle characteristics within the same EEG signal. Both the original signal segment and the band-passed (11–16 Hz) version of the signal segment are presented to assist visualization. The solid red line indicates the start of the spindle and the dashed line indicates the end; the green lines indicate the envelope of the signal. In practice, some experts use both the signal and the band-passed version of the signal to assess the presence of spindles.

