
Figure 2.
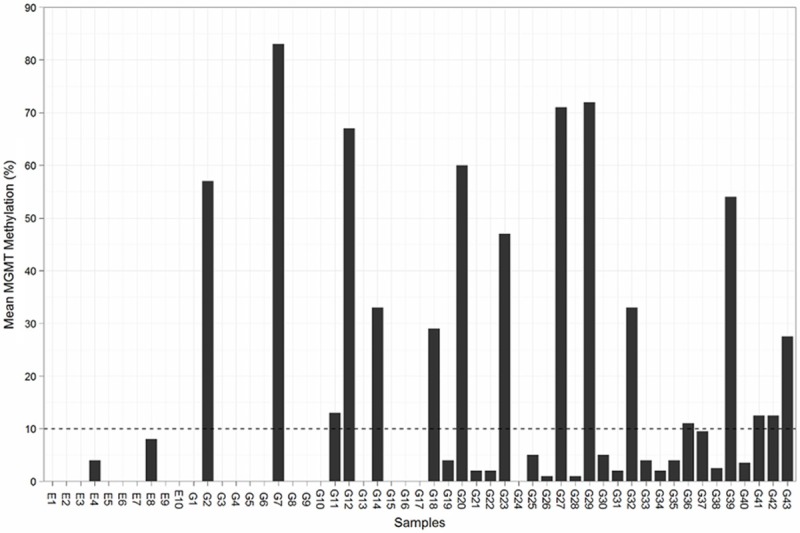
Mean MGMT methylation of tissue specimens from epilepsy patients (E1-E10) and glioma patients (G1-G43). The dash line represents a 10% cutoff.
Official websites use .gov
A
.gov website belongs to an official
government organization in the United States.
Secure .gov websites use HTTPS
A lock (
) or https:// means you've safely
connected to the .gov website. Share sensitive
information only on official, secure websites.
Mean MGMT methylation of tissue specimens from epilepsy patients (E1-E10) and glioma patients (G1-G43). The dash line represents a 10% cutoff.