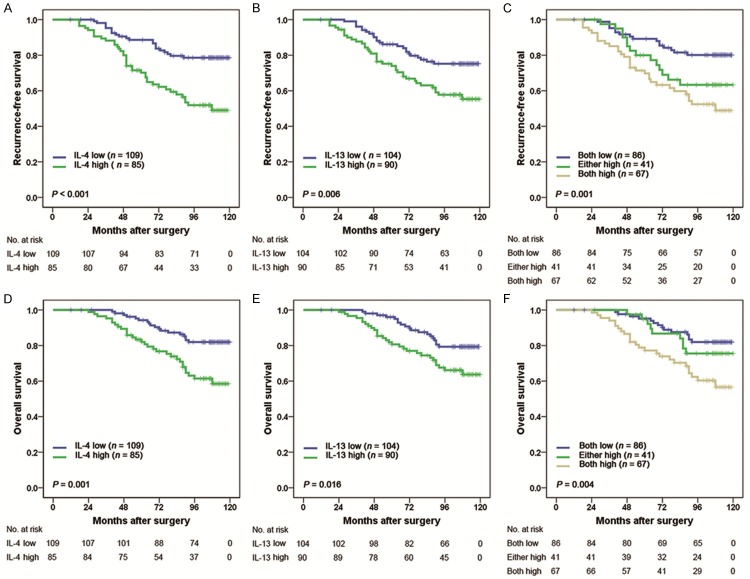
Figure 2.
Kaplan Meier curves showing RFS (A-C) and OS (D-F) probabilities based on intratumoral IL-4 and IL-13 expression levels. In (C and F), patients were classified into 3 groups: group I, both low IL-4 and low IL-13 expression; group II, either high IL-4 or high IL-13 expression; group III, both high IL-4 and high IL-13 expression.

