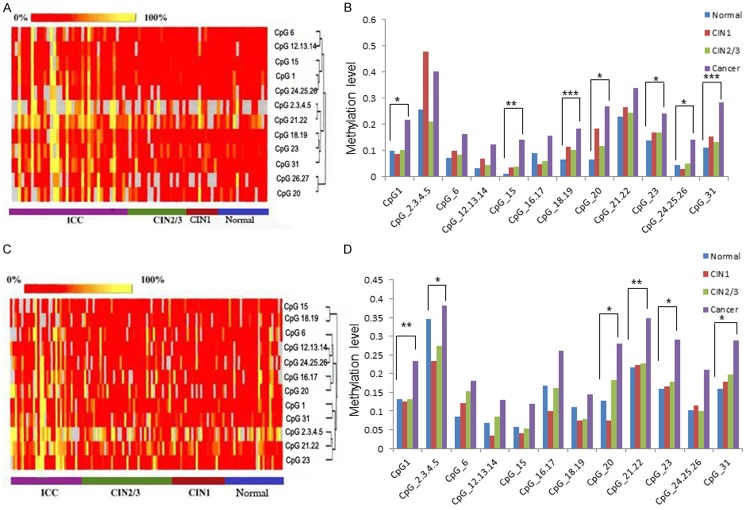
Figure 1.
DNA methylation status of TFPI2 in Uygur patients. A. Clustering analysis diagram of ICC, CIN2/3, CIN1 and normal lesion grades in Uygur. Yellow shows that the methylation rate is 100%, red shows 0%, gray indicates areas that have not been analyzed. Each line represents one CpG site, and each column represents one lesion grade. Clustering analysis diagram showing positive correlation of methylation level with lesion grade. B. A histogram depicting the methylation level of every CpG site with differences between the four lesion grades and the trend of the methylation indicated. C. Clustering analysis diagram in Han. Clustering analysis diagram showing positive correlation of methylation level with lesion grade. D. The histogram indicates the difference between the four lesion grades in Han. *P < 0.05, **P < 0.01, ***P < 0.001.

