
Figure 4.
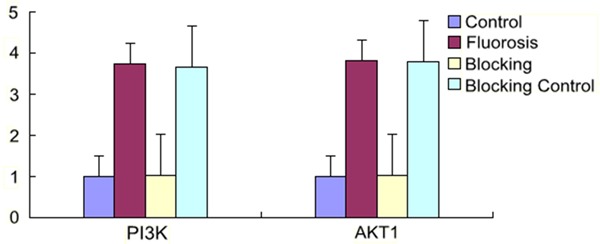
Real-time PCR. The expression of the fluorosis group and the blocking control group increased obviously with statistical significance (P<0.05); The comparisons both between the fluorosis group and the blocking control group and between the control group and the blocking group showed no statistically significant difference (P > 0.05).