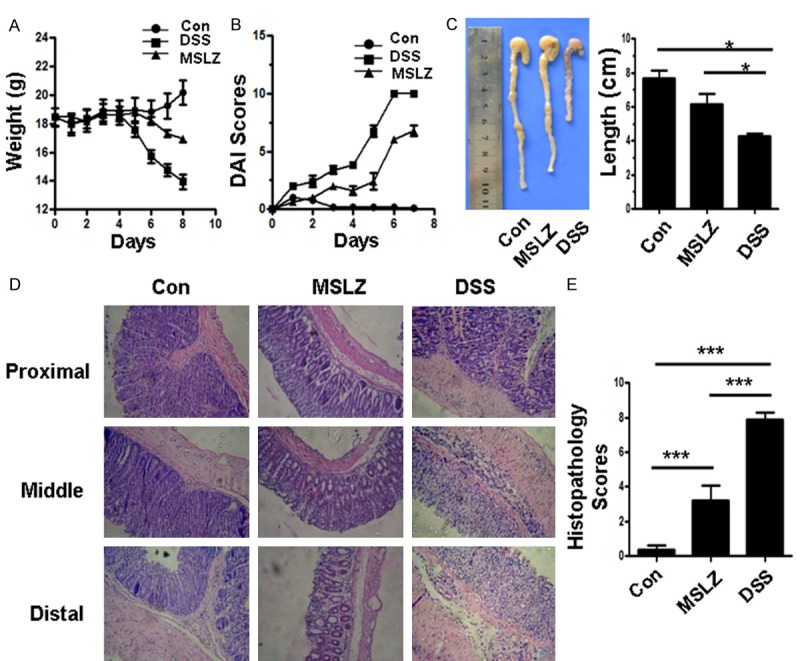
Figure 2.

DAI scores and histopathology scores of mice. (A) and (B) show body weight changes and DAI scores, respectively. (C) shows the colon length of each group. (D) shows representative images for histopathological changes in each group, (E) is statistical analysis of histopathological changes. *P < 0.05; **P < 0.01; ***P < 0.001.
