
Figure 6.
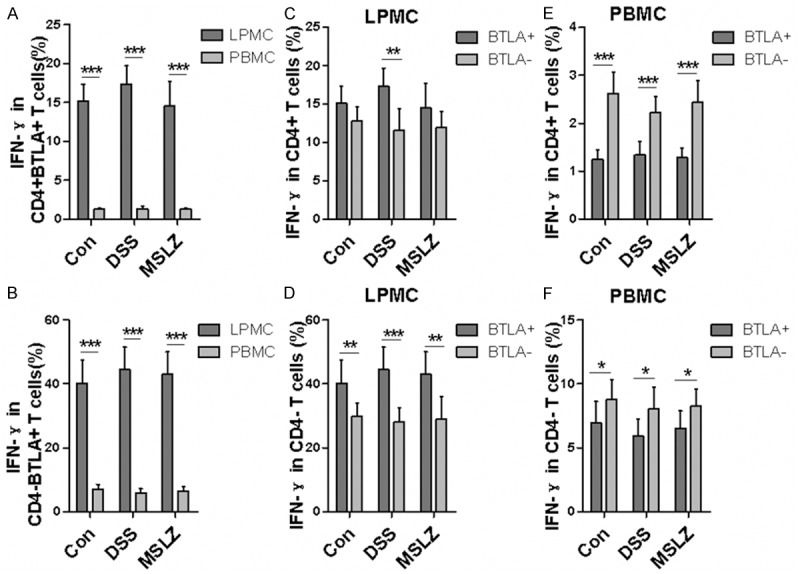
Intracellular cytokine stain of IFN-γ in BTLA+ T cells. LPMCs and PBMCs were stained with surface marker and intracellular IFN-γ. A and B. Show IFN-γ production in CD4+ BTLA+ and CD8+ BTLA+ T cells. C and D. IFN-γ production in BTLA+ and BTLA- T cells from LPMCs. E and F. IFN-γ production in BTLA+ and BTLA- T cells from PBMC. *P < 0.05; **P < 0.01; ***P < 0.001.