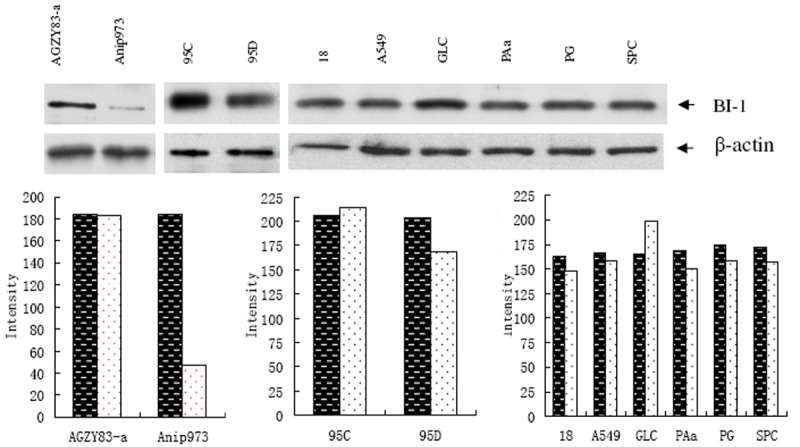
Figure 3.

Western blot analysis of BI-1 expression in 10 NSCLC cell lines. Each lane of the blots showed a 26.5 KD band of BI-1, and the immunoreactive bands were significantly stronger in AGZY83-a and 95C than in Anip973 (P < 0.01) and 95D (P < 0.05). β-actin was loading control. The black columns indicated the levels of β-actin while white columns indicated those of BI-1.
