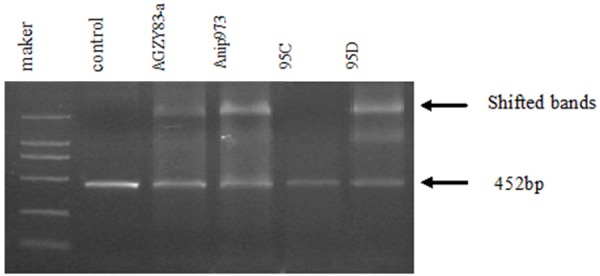
Figure 4.

EMSA analysis. Equal amount of untreated PCR product was used as control. A decreased original band and a retarded band larger than 2 kb were detected in almost all the lanes (indicated by arrows), and the shifted bands were much stronger in 95D and Anip973 than in 95C and AGZY83-a.
