
Figure 1.
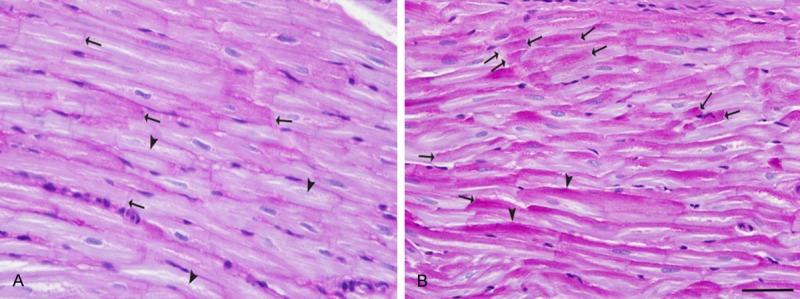
Differential glycogen concentration and distribution in the RAA and LAA as shown by PAS staining. A. In the RAAs glycogen deposition delicately highlighted the intercalated discs (arrows). Also glycogen deposition was seen along and within several myocytes (arrowheads). B. In contrast to the RAAs, in the LAAs glycogen often coalesced against intercalated discs (arrows) with dense tails of glycogen extending into the cells along the lateral wall at the myocyte-myocyte junctions (arrowheads). Periodic-acid Schiff (PAS) stain. Bar = 50 μm.