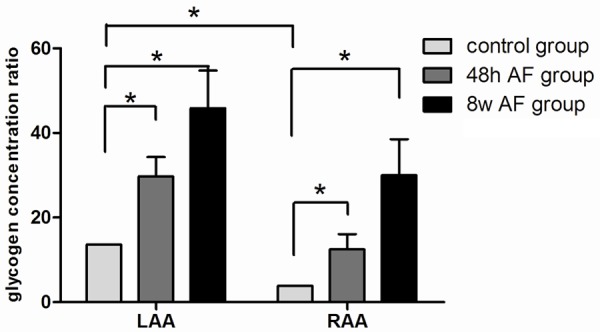
Figure 2.

Graphic representation of the glycogen concentration in RAA and LAA in the baseline state and after pacing induced AF for 48 hours and 8 weeks. Atrial fibrillation promoted glycogen deposition. The level of glycogen deposition in 48 hour AF group was significantly higher than that in the control group and was the highest in the 8 week group. Values are represented as mean ± standard deviation, asterisk (*) indicates a P < 0.05 compared with control group. See text for further discussion.
