
Figure 2.
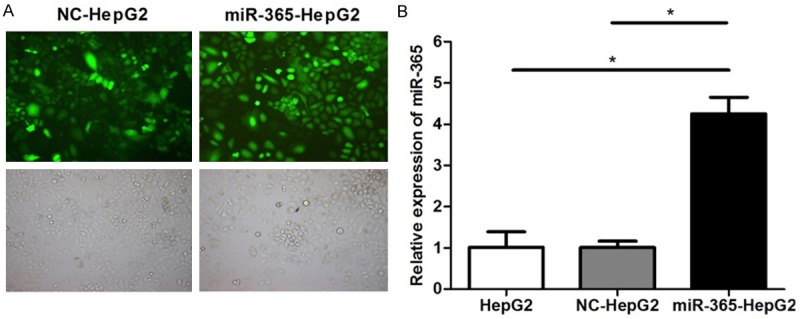
Overexpression of miR-365 in HepG2 cell. HepG2 cells were untransfected (HepG2) or transfected with NC mimics (NC-HepG2) or miR-365 mimics (miR-365-HepG2). A. Representative fluorescence microscopy images (× 100, top) and bright field microscopy images (× 100, bottom) are at left. B. Validation of miR-365 overexpression in HepG2 cells by qRT-PCR analysis. (*P < 0.05).