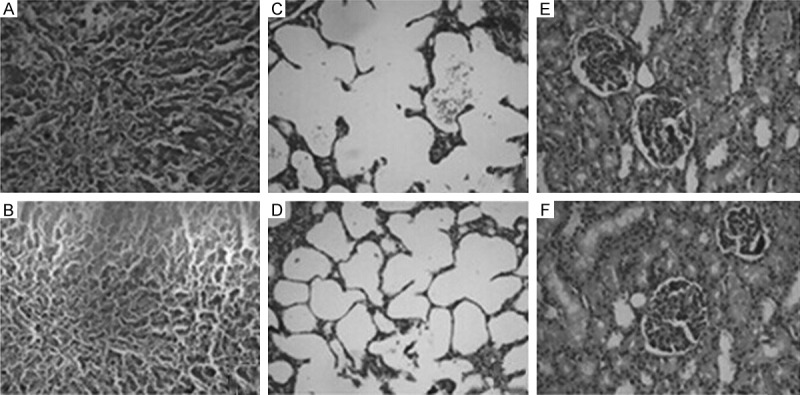
Figure 2.

Lung, liver and kidney histology after LPS-induced systemic inflammation. Rats were no treated with CVVH (Control group), LPS followed by CVVH (CVVH group). Representative liver sections are shown for (A) Control, (B) CVVH group. Representative lung specimens are shown for (C) Control group, (D) CVVH group. Representative kidney specimens are shown for (E) Control group, (F) CVVH group. All sections were stained with hematoxylin and eosin, and magnified at 200.
