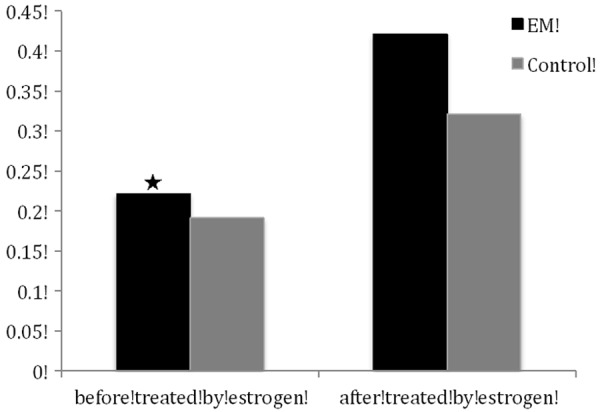
Figure 3.

Normalized density was analyzed using the internal β-actin as reference (means ± SD). ★: P < 0.05, compared with the normalized density of FAK proteins in endometrial tissues of controls. ✻: P < 0.05, compared with the normalized density of FAK proteins in endometrial tissues of controls.
