
Figure 5.
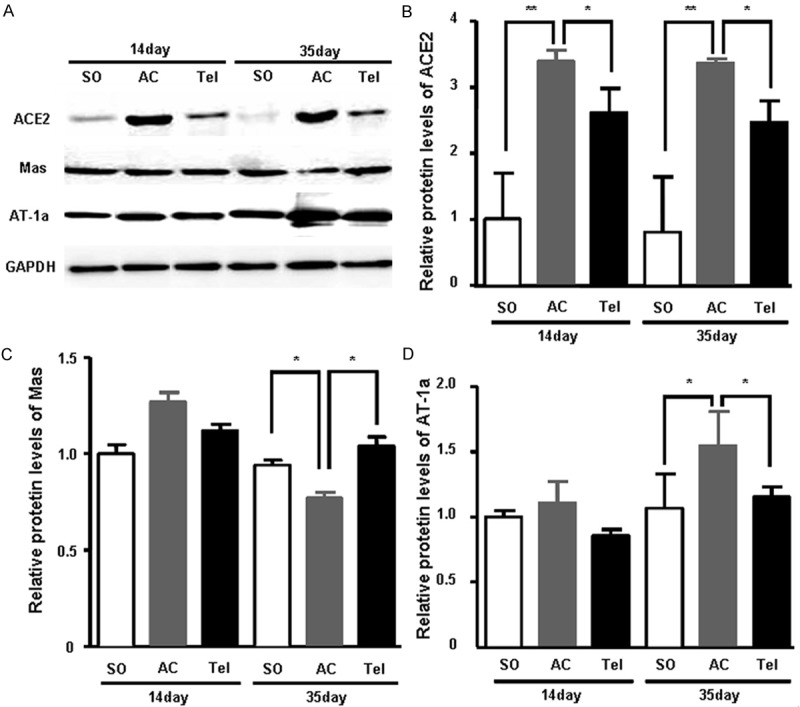
The protein expression of ACE2, Mas and AT1α in myocardial tissue. A. Myocardial tissue homogenates from SD rats after surgery of aortic stenosis or telmisartan treatment were subjected to SDS-PAGE. The non-responsive gene GAPDH is shown as loading control. B. Quantitive analysis of ACE2 protein expression. C. Quantitive analysis of Mas protein expression. D. Quantitive analysis of AT1α protein expression. SO represents sham operation group. AC represents aortic stenosis group. Tel represents telmisartan intervention group.