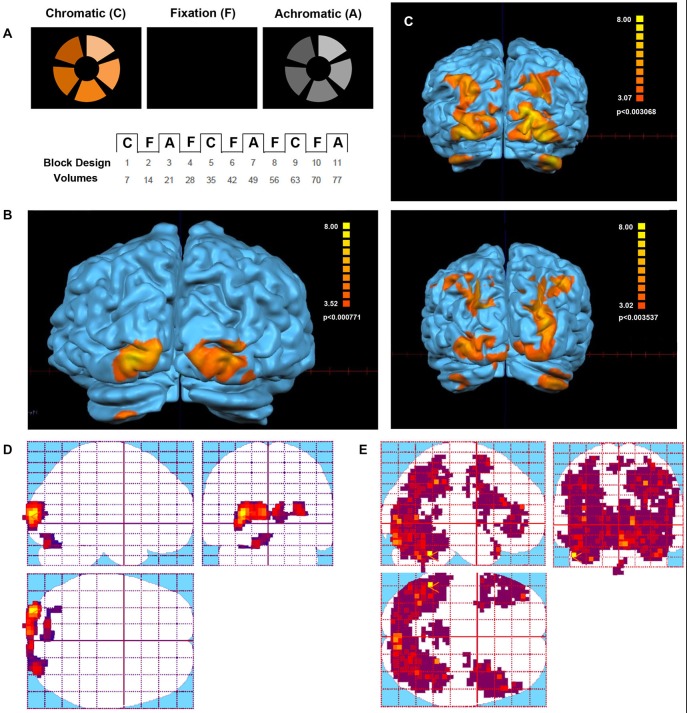
Figure 1.
Visual stimulus and Functional Magnetic Resonance Imaging (fMRI) activation in the Eyeborg user and the control group. (A) Protocol of the Farnsworth-Munsell test. Within each scan series, the stimulus alternated between blocks of chromatic or achromatic discrimination trials and fixation. (B) Areas showing a significant response to chromatic stimulation in the Eyeborg user. (C) Areas showing a significant response to chromatic stimulation in two representative controls (single subjects). (D) Statistical parametric maps of the Eyeborg user are shown in standard anatomical space. (E) Statistical parametric maps of the whole control population in standard anatomical space.

