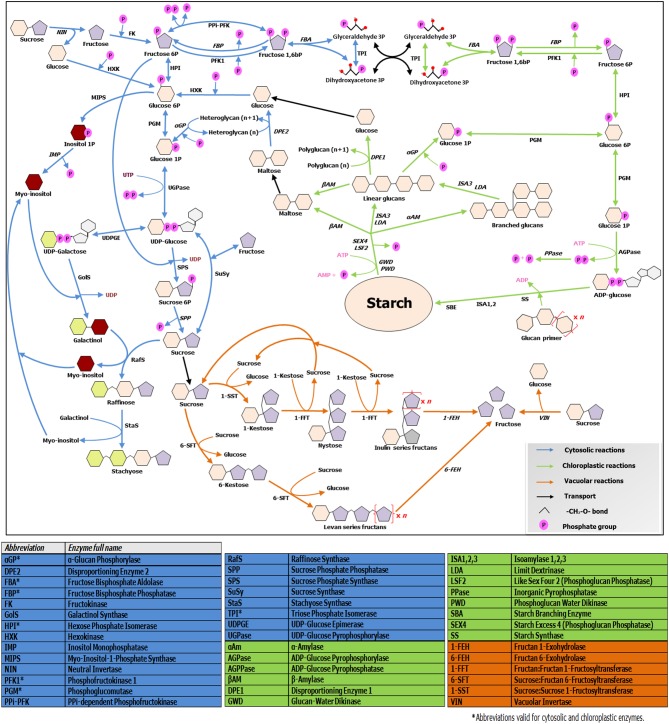
Figure 2.
Overview of soluble sugars, RFO, fructans and starch metabolic pathways. The scheme illustrates connections and divergences between the above mentioned pathways, taking in account their different subcellular environments. Enzymes involved in catabolic steps are written in italic. Note that only the metabolism of linear fructans is illustrated, due to space constraints. For further details, readers are referred to http://plantsinaction.science.uq.edu.au/book/export/html/121. for starch and sucrose metabolism; and to Vijn and Smeekens (1999) and Nishizawa et al. (2008) for more details on fructan and raffinose biosynthesis, respectively.

