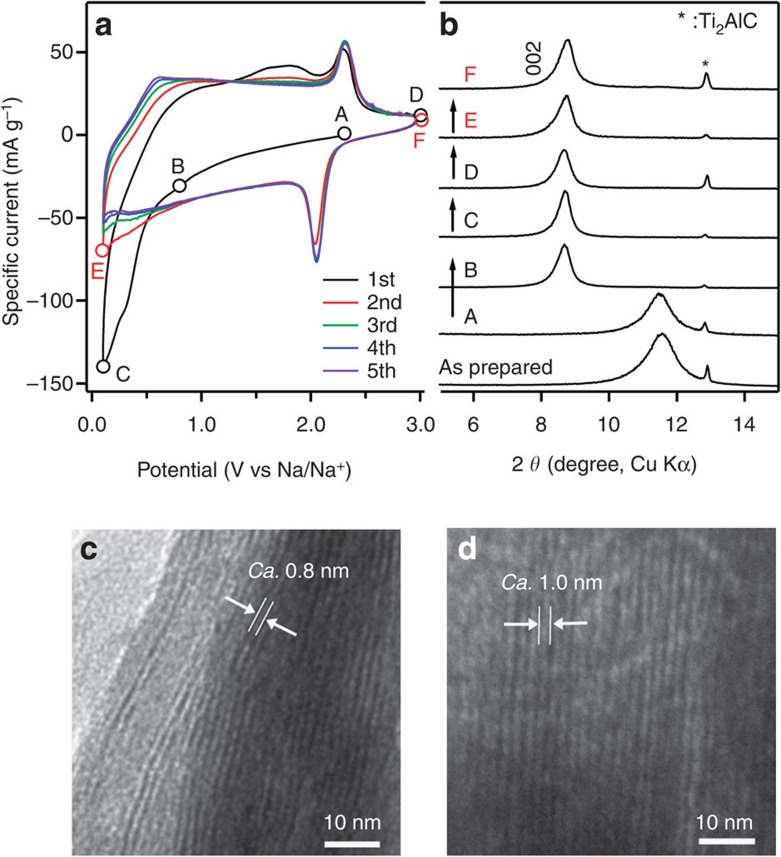
Figure 1. Electrochemical properties and associated structural changes of the Ti2CTx.
(a) CV for Ti2CTx in a 1 M NaPF6/EC−DEC electrolyte at a scan rate of 0.2 mV s−1. (b) Ex situ XRD patterns during the CV cycles. (c) Transmission electron microscopy (TEM) image of the pristine Ti2CTx. (d) TEM image of activated Ti2CTx after the first CV.

