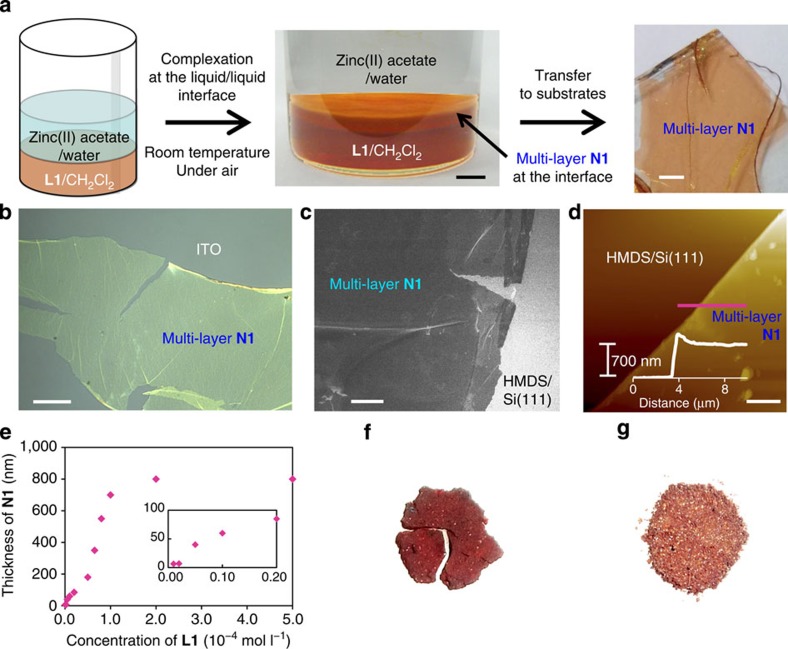
Figure 2. Synthesis and microscopic analysis of multi-layer N1.
(a) Schematic illustration and photographs of the liquid/liquid interfacial synthesis and multi-layer N1 transferred onto an ITO substrate. Scale bars, 5 and 1 mm, respectively. (b) Optical microscopic image on an ITO substrate. Scale bar, 50 μm. (c) Field-emission scanning electron microscopic (FE-SEM) image on HMDS/Si(111). Scale bar, 20 μm. (d) Atomic force microscopic image on HMDS/Si(111) and its cross-section analysis along the magenta line. Scale bar, 5 μm. (e) Control of the thickness based on the concentration of L1 in the liquid/liquid interfacial synthesis. The inset shows a close-up of the low concentration region. Reaction time, 4 days. Temperature, room temperature. Container, cylindrical glass vial with a diameter of 3.2 cm. Volume of the upper (aqueous) layer, 20 ml. Volume of the lower (dichloromethane) layer, 10 ml. Concentration of zinc(II) acetate in the upper layer, 0.05 mol l−1. (f,g) Photographs of the products of single-phase reactions in dichloromethane at room temperature and in N,N-dimethylformamide at 105 °C, respectively.

