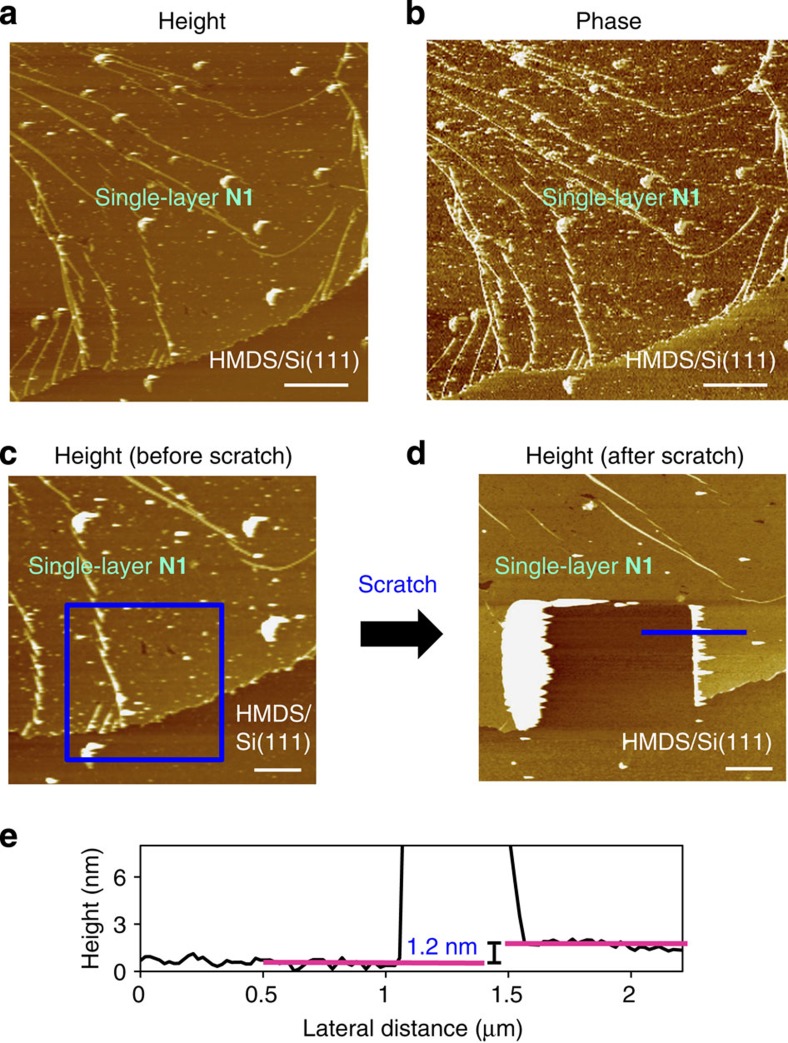
Figure 5. Atomic force microscopy for single-layer N1.
(a,b) Height and phase images on HMDS/Si(111). Scale bar, 2 μm. (c,d) Height images before and after a scratch by the AFM tip. The blue square indicates the scratched region. Scale bar, 1 μm. (e) Cross-section analysis at one of the steps in the scratched region (shown as a blue line in d).

