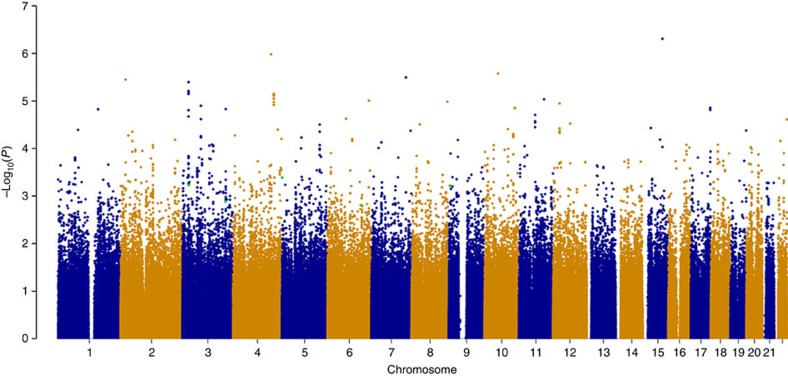
Figure 1. Genome-wide association of JAK2V617F-negative myeloproliferative neoplasms.
This Manhattan plot shows the results of the stage 1 GWAS for all autosomes. Results are plotted as –log10 of the allelic χ2 P value. At this stage, no SNPs met the stringent genome-wide significance level of P value ≤10−8. The three SNPs that attained genome-wide significance and two additional SNPs with moderate association following meta-analysis are highlighted in green, on chromosome 3 (rs2201862 and rs4858647), chromosome 5 (rs2736100), chromosome 6 (rs9376092) and chromosome 9 (rs12339666). This plot was produced using the qqman R package.

