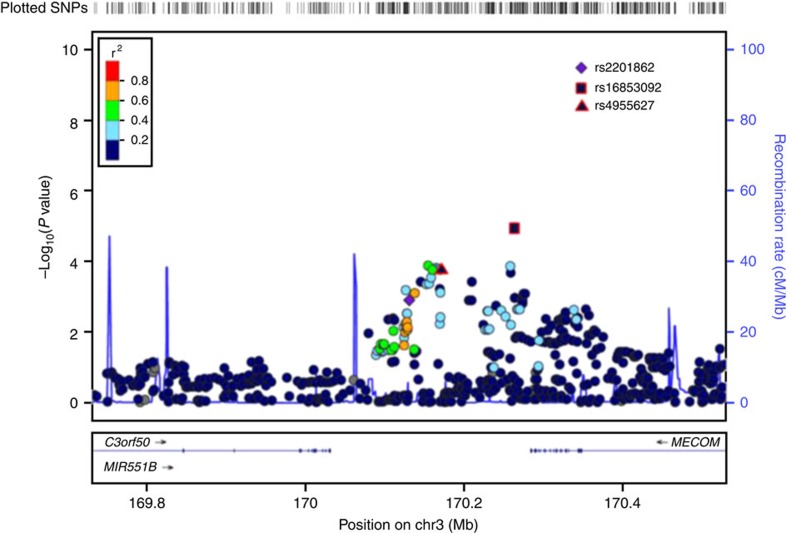
Figure 2. A plot of the stage 1 GWAs for the most significant novel SNP (rs2201862) identified by meta-analysis.
This plot shows the stage 1 results (n=524 JAK2V617F-negative cases versus n=2674 controls) in a 400-kb region, which flanks the most significant SNP identified by meta-analysis (rs2201862). SNPs are plotted as the −log10 of the allelic χ2 P value. The amount of LD between rs220186 and all other SNPs is indicated by the colour of the data points. The two SNPs with red borders (rs16853092 and rs4955627) were also genotyped and replicate at stage 2 but were not taken forward to stage 3 because rs2201862 was more significant at stage 2. The plot was produced using LocusZoom.

