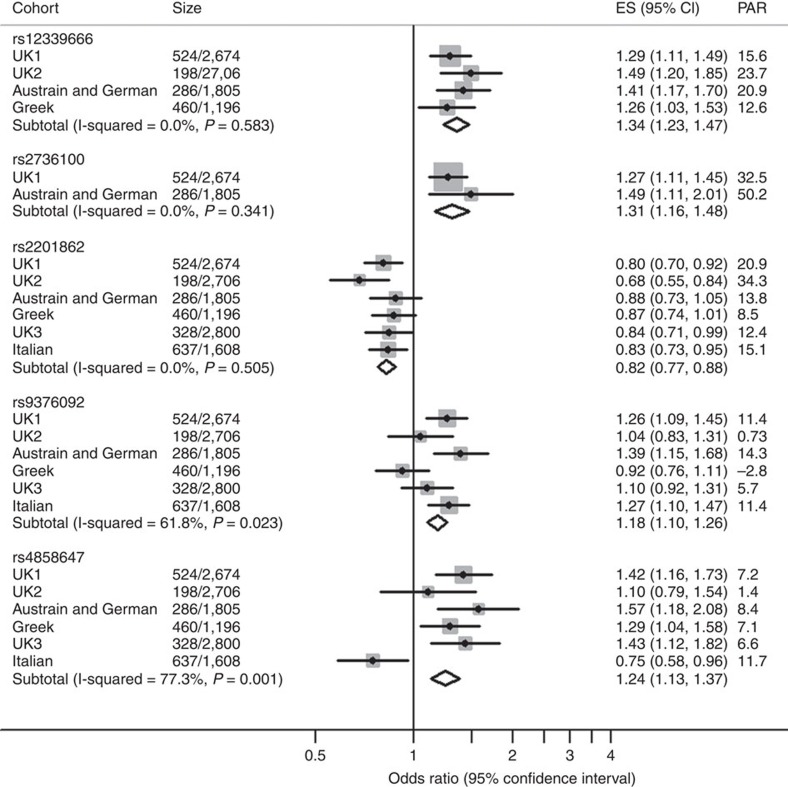
Figure 3. Forest plots and meta-analysis of genotype data for the five most significant associations.
Forest plots showing the odds ratios (OR=ES), 95% confidence intervals (CI) and population attributable risk (PAR) of SNPs with or approaching a genome-wide level of significance in each cohort and in the combined analysis. The SNP subtotals show the OR and CI for a fixed-effects meta-analysis and use I-squared to assess heterogeneity in effect sizes between cohorts.

