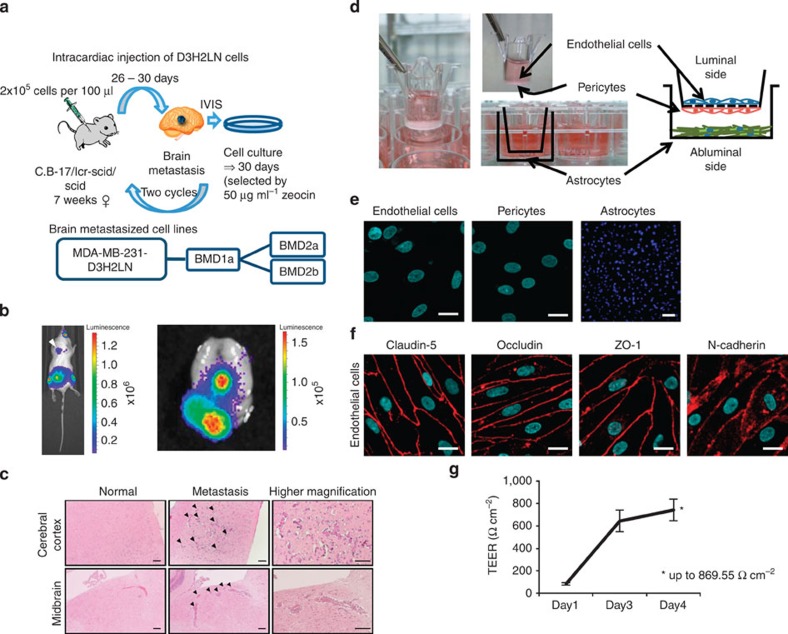
Figure 1. Establishment of brain metastasis breast cancer cell lines and BBB in vitro model.
(a) Schematic representation of the protocol for the in vivo-selected brain metastatic derivatives. MDA-MB-231-luc-D3H2LN breast cancer cell lines (2 × 10⁵ cells) were injected intracardially into C.B-17 Icr-scid scid mice. After 26–30 days, the brain metastasis of cancer cells was monitored by in vivo imaging system (IVIS). The brain-metastasized cancer cells were recovered and cultured for ~30 days in a culture medium containing 50 μg ml−1 Zeocin. This selection was performed twice, and we named the established cell lines BMD2a and BMD2b. (b) Bioluminescence image of a mouse with a BMD2a brain metastasis (left). Right image represents the bioluminescence image of a mouse brain with cancer cell metastasis. (c) Representative image of HE-stained sections from a mouse brain cerebral cortex and midbrain. Left upper and lower panels show the mouse cerebral cortex and midbrain, respectively, without metastasis of cancer cells. Middle upper and lower panels show the mouse cerebral cortex and midbrain, respectively, with metastasis of cancer cells. Arrow-head represent metastatic cancer cells. Right upper and lower panels show higher magnification. Scale bar, 100 μm. (d) The schematic representation of the in vitro model of BBB constructed from primary cultures of monkey brain capillary endothelial cells, brain pericytes and astrocytes. (e) Representative pictures of endothelial cells, pericytes and astrocytes are shown. Endothelial cells and pericytes were visualized using a confocal microscope. Astrocytes were visualized using a fluorescence microscope. Scale bar, 20 μm. Scale bar in the panel of astrocytes represents 100 μm. (f) Immunofluorescence of tight junction proteins (Claudin-5, Occludin and ZO-1) and N-cadherin (red). Scale bar, 20 μm. (g) The transition of TEER after thawing until the start of the experiment. After thawing the BBB in vitro model, the value of TEER increased to a maximum of 869.55 Ω cm−2 (*mean maximum TEER.). Error bars represent s.d., n=12. Data are representative of at least three independent experiments each. (Fig. e,f,g).

