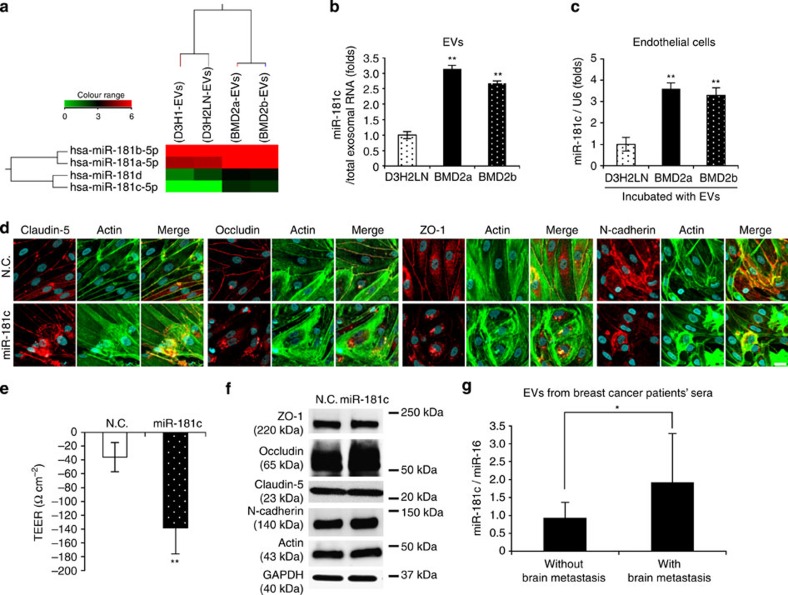
Figure 5. miR-181c played a role in BBB breakdown and upregulation in brain metastasis patients’ sera.
(a) Heat map showing expression levels of the miR-181c in cancer-derived EVs. (b) Amount of miR-181c in EVs isolated from D3H2LN, BMD2a and BMD2b cells. Error bars represent s.d., Student’s t-test, n=3. **P<0.01 as compared with EVs from D3H2LN cells. (c) Endothelial cells were incubated with EVs isolated from D3H2LN, BMD2a or BMD2b cells for 24 h. RNA was isolated from the endothelial cells 24 h after the addition of EVs, and the expression of miR-181c in the endothelial cells was analysed by qRT-PCR. Each bar represents the mean s.d., Student’s t-test, n=3. **P<0.01 as compared with endothelial cells treated with EVs from D3H2LN cells. (d) Co-immunostaining of Claudin-5, Occludin, ZO-1, N-cadherin (red) and actin filaments (green) in endothelial cells after the addition of EVs from D3H2LN, BMD2a or BMD2b cells. Scale bar, 20 μm. These proteins localized to the cytoplasm in miR-181c-transfected cells. (e) The TEER value was monitored before (day 4) and after (day 5) the transfection of miR-181c or control siRNA. Transfected miR-181c or N.C. siRNA was incubated in the in vitro BBB model for 24 h. Error bars represent s.d., Student’s t-test, n=3. (**P<0.01). (f) Western blot analysis of tight junction proteins, N-cadherin, actin and GAPDH. Proteins were from endothelial cells transfected with N.C. siRNA or miR-181c. This experiment was repeated twice. (g) Amount of miR-181c in EVs isolated from patients’ sera. Non-brain metastasis: n=46, brain metastasis: n=10 (*P<0.05). Associations between the miR-181c expression levels of serum from breast cancer patients were assessed by Student's t-test. Data are representative of at least three independent experiments each (Fig. b,c,d,e).

