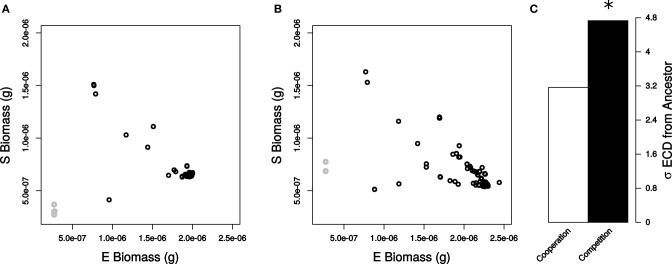
Figure 2.

Community state resulting from genetic perturbations in E. coli. Final biomass of each simulated species when bacteria were (A) cooperating and (B) competing. Non-essential reactions (black) and essential reactions (gray) are displayed in each plot. (C) Standard deviations of ECD values for all non-essential reactions for cooperation (white) and competition (black). Deviations in ECD were significant (star) by a Levene Test (P < 2.2 × 10⁻¹⁶).
