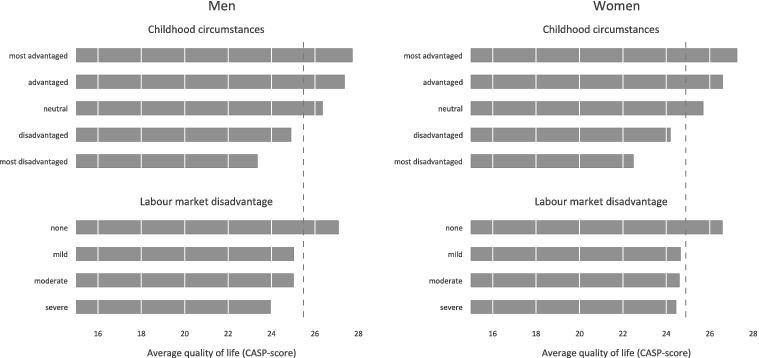
Figure 1.

Quality of life by childhood circumstances and labour market disadvantage for men (N = 4808) and women (N = 5463).
Note: Dashed line presents overall averages in quality of life for men and women.

Quality of life by childhood circumstances and labour market disadvantage for men (N = 4808) and women (N = 5463).
Note: Dashed line presents overall averages in quality of life for men and women.