Figure 4.
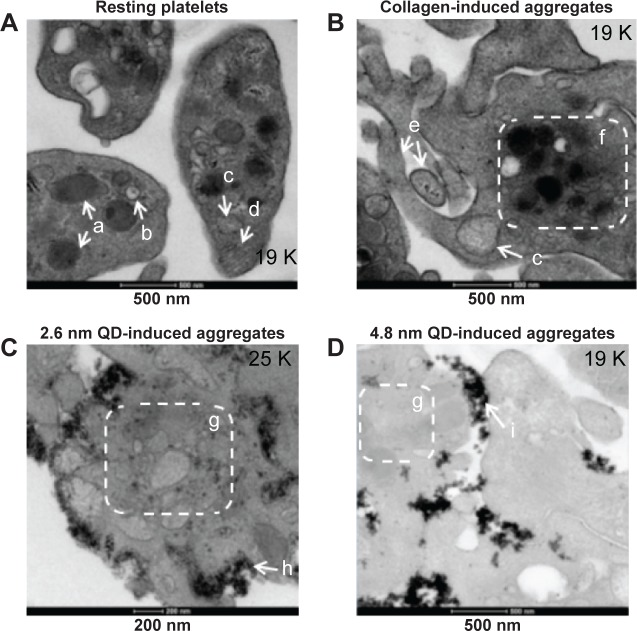
Association of QD agglomerates with platelets, as observed using transmission electron microscopy.
Notes: Washed platelets were treated with negatively charged 2.6 nm or 4.8 nm size CdTe QDs in optical aggregometer. Samples were fixed with glutaraldehyde at 20% aggregation in the aggregometer. After washing the platelet aggregates with phosphate-buffered saline, the samples were processed and subjected to transmission electron microscopy imaging. Negative control (A) was untreated resting platelets, and positive control (B) was collagen-induced aggregates; 2.6 nm (C) and 4.8 nm (D) QD-induced platelet aggregates are shown. Images are representative of three independent experiments. (a) α granules; (b) dense granules; (c) mitochondrion; (d) microtubules; (e) pseudopodia; (f) organelles concentrated in the center of the cytoplasm; (g) degranulatedintracellular granules; (h) 2.6 nm CdTe QDs; (i) 4.8 nm CdTe QDs.
Abbreviations: CdTe, cadmium–telluride; QD, quantum dot.

