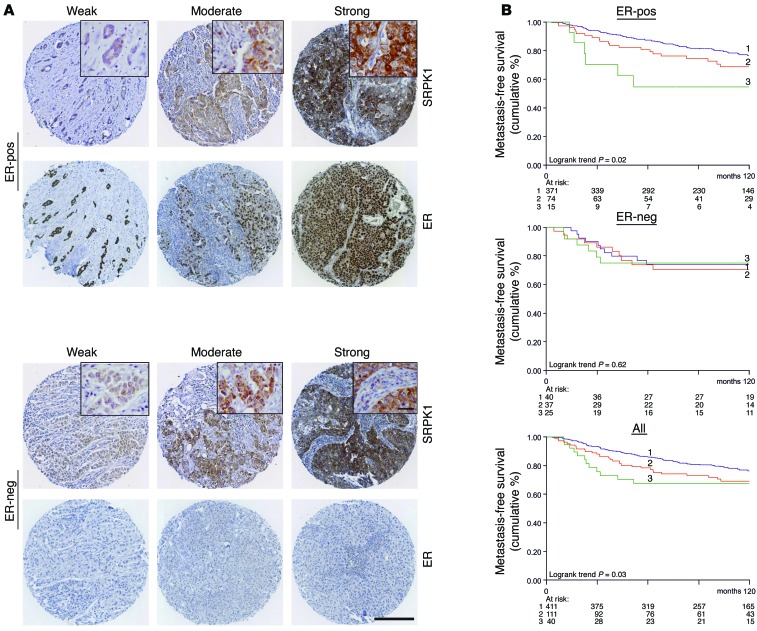
Figure 4. SRPK1 protein levels correlate with poor prognosis in BC patients.
(A) TMAs of lymph node–negative BC patients (n = 562) without prior treatment were stained for SRPK1 and scored. Examples of weak (score 1), moderate (score 2), and strong (score 3) SRPK1 intensity in the TMA are shown for ER-positive and ER-negative samples. Scale bar: 200 μm, inset 20 μm. (B) Increased expression of SRPK1 correlated with decreased MFS in ER-positive patients (n = 460, log-rank P < 0.05, top graph), but not ER-negative patients (n = 102, middle graph). For all patients combined, SRPK1 expression was associated with worse prognosis (log-rank P < 0.05, bottom graph).

