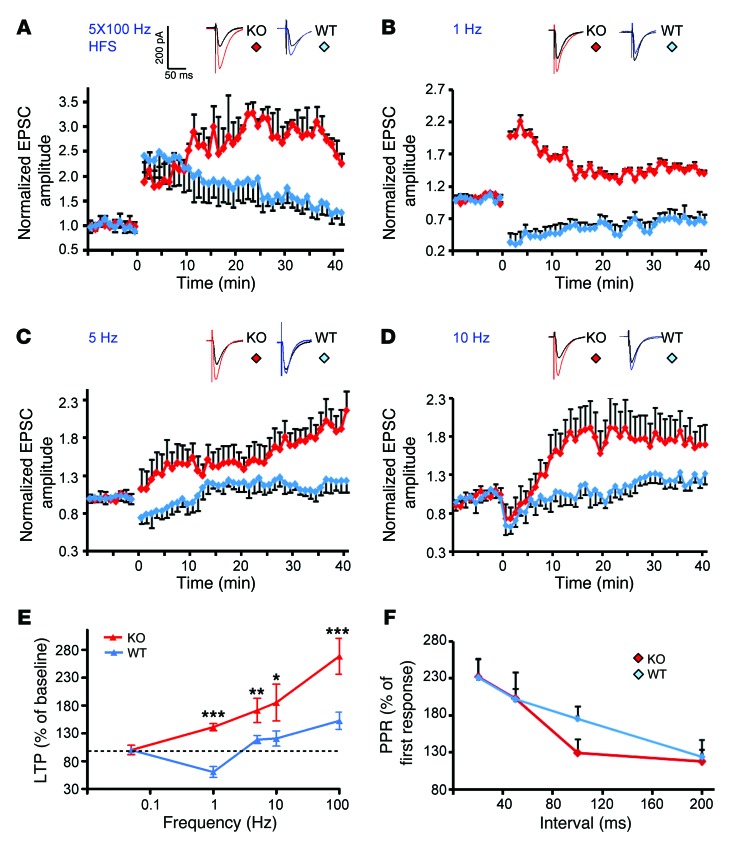
Figure 3. Bai1–/– mice display changes in frequency-dependent synaptic plasticity.
(A) HFS-induced LTP was elicited using 5 × 100 Hz trains of stimulation at 20-second intervals. Note the enhanced potentiation after HFS stimulation in slices from KO mice (red) compared with slices from WT mice (blue) (6 mice/WT group, 4 mice/KO group; P < 0.001). (B) Stimulation (900 pulses) delivered at 1 Hz induced LTD in slices from WT mice (blue), but conversely induced robust LTP in KO mice (red) (n = 3 mice/group; P < 0.001). (C) Stimulation (900 pulses) was delivered at either 5 Hz or 10 Hz (D). Note that both stimulation protocols induced enhanced LTP in slices from KO animals (red) (4 mice/WT group, 3 mice/KO group; P < 0.05 and P < 0.01, respectively). (E) Summary of the ability of different frequencies of stimulation to induce changes in synaptic strength in hippocampi of WT (blue) and KO mice (red) mice. ***P < 0.001; **P < 0.01; *P < 0.05. (F) PPR was measured using pairs of presynaptic stimulation pulses separated by 20, 50, 100, and 200 ms. All data represent the mean ± SEM and were analyzed using the 2-tailed Student’s t test.

