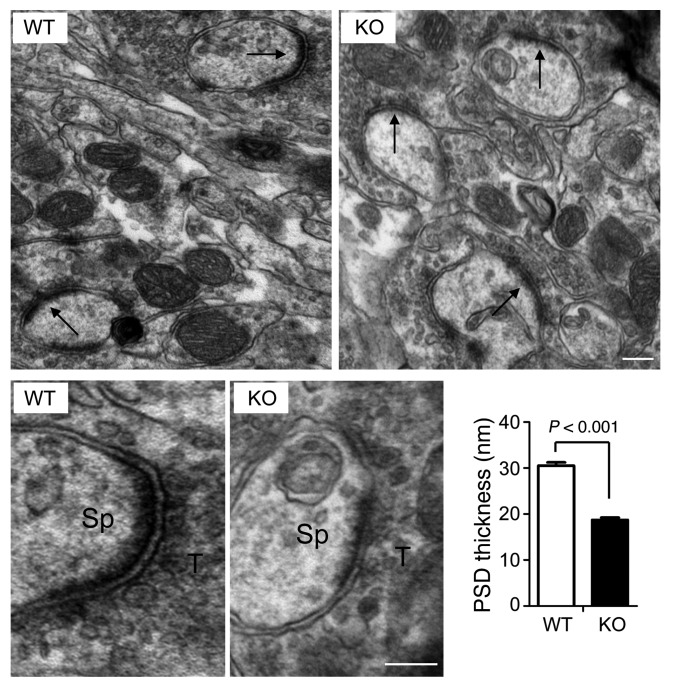
Figure 5. Decrease in PSD thickness in Bai1–/– hippocampal neurons by electron microscopic analysis.
Top: Representative electron micrographic images of asymmetric axospinous synapses (arrows) in the CA1 region of adult WT and KO mice. Bottom: High-magnification images showing individual synapses. Sp, spine; T, axon terminal. Scale bars: 100 nm. Histogram shows the significant difference in the mean ± SEM of PSD thickness between WT and KO animals (n = 5 mice/group; P < 0.001 by 2-tailed Student’s t test).

