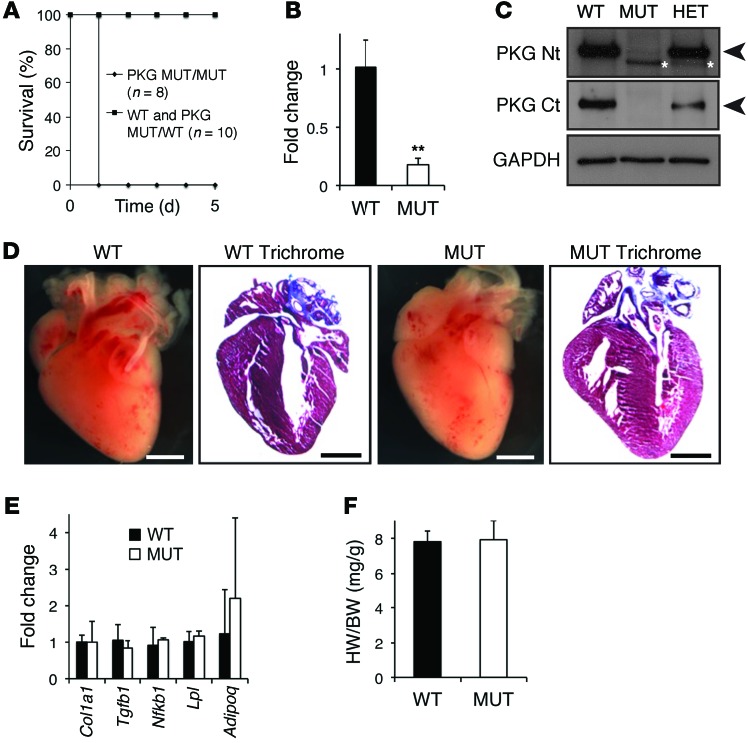
Figure 1. Characterization of the OriNax knockin mouse.
(A) Kaplan-Meier survival curves of WT or OriNax (MUT) mice. Note that all OriNax pups died at PD1, while none of WT littermates did. PKG, plakoglobin. (B) Quantification of mRNA levels of plakoglobin relative to Gapdh levels. Note significant downregulation in the mutant allele. n = 6 mice per genotype. (C) Western blot of WT, heterozygote (HET), and homozygote OriNax mice with N-terminal (PKG Nt) and C-terminal (PKG Ct) antibodies for plakoglobin. GAPDH served as a loading control. Note reduced molecular weight (MW) and amount of plakoglobin in OriNax and HET mice (white asterisks). Arrowheads denote predicted MW of plakoglobin. n = 6 mice per genotype. (D) Macroscopic views of Masson’s Trichrome–stained hearts isolated from WT and OriNax PD1 mice. Note lack of gross morphological defects or fibrosis in hearts from OriNax mice compared with WT littermates. Scale bar: 1 mm. n = 6 mice per genotype. (E) qRT-PCR analysis of indicated genes compared with Gapdh levels. Note that no changes of collagen 1A, Tgfb1, Nfkb, lipoprotein lipase, and adiponectin were observed between WT and OriNax hearts. n = 6 mice per genotype. (F) Heart weight/body weight ratios (HW/BW) were calculated for WT and OriNax mice. n = 6 mice per genotype. Data represent mean ± SEM; **P < 0.01 according to 2-tailed Student’s t test.

