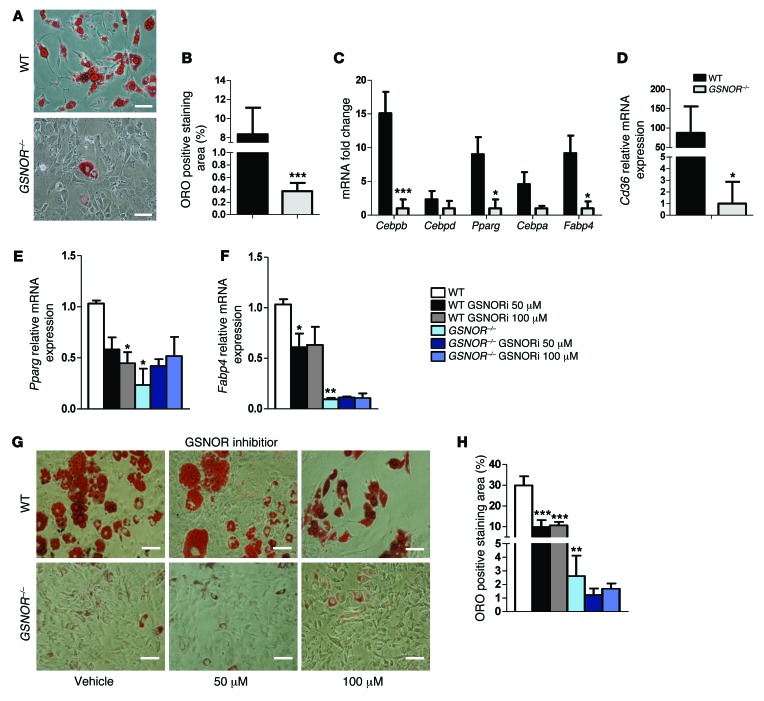
Figure 1. GSNOR–/– MSCs have impaired adipogenic differentiation.
(A) ORO staining of WT and GSNOR–/– cells. Scale bars: 100 μm. n = 6. (B) ORO staining was quantified and normalized to baseline staining. ***P < 0.001. n = 6. (C) Expression of adipogenic genes in WT and GSNOR–/– MSCs grown in adipogenic medium, analyzed by 1-way ANOVA (overall P < 0.0001). n = 5–7. *P < 0.05; ***P < 0.001, compared with WT, analyzed by Bonferroni’s multiple comparison test. (D) Expression of Cd36 in WT and GSNOR–/– MSCs grown in adipogenic medium. *P < 0.05. n = 6. (E and F) Expression of Pparg (E) (2-way ANOVA; for strain, P = 0.0313; for drug, P = 0.5547) and Fabp4 (F) (2-way ANOVA; for strain, P < 0.0001; for drug, P = 0.2736) after GSNOR inhibitor treatment. *P < 0.05, compared with WT, analyzed by Bonferroni’s multiple comparison test. n = 3. (G) ORO staining of WT and GSNOR–/– MSCs grown in adipogenic medium and treated with 50 μM or 100 μM GSNOR inhibitor (GSNORi) for 2 weeks. Scale bars: 100 μm. n = 3. (H) ORO staining was quantified (2-way ANOVA; for strain, P < 0.0001; for drug, P = 0.0014). **P < 0.01; ***P < 0.001, compared with WT, analyzed by Bonferroni’s multiple comparison test. n = 3. Statistical significance between 2 groups was determined by unpaired Student’s t test (2-tailed) and presented as mean ± SEM.

