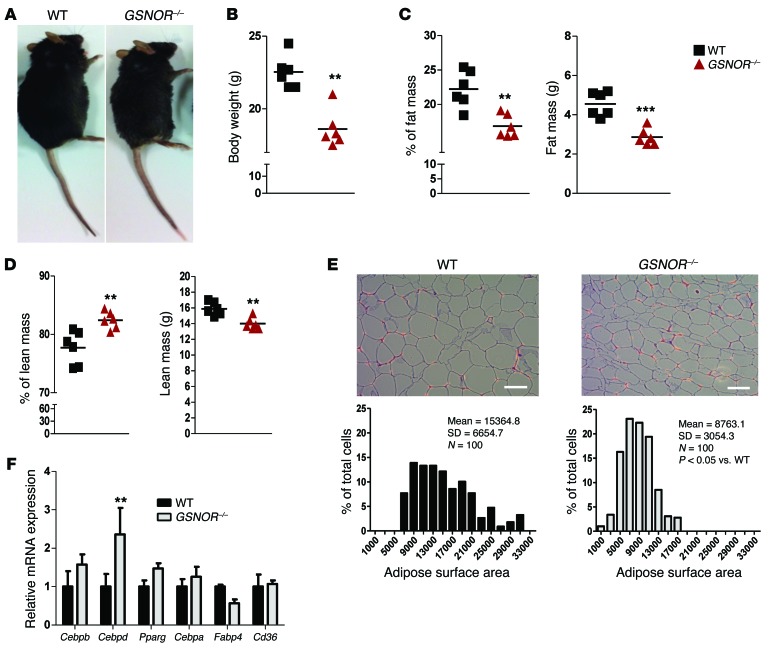
Figure 3. GSNOR–/– mice have reduced body weight, fat mass, and adipocyte size.
(A and B) Whole-body morphology and body weight of 2-month-old male WT and GSNOR–/– mice. **P < 0.01. n = 6. (C and D) Percentage and weight of fat mass (C) and percentage and weight of lean mass (D) of 2-month-old male mice were measured by DEXA. **P < 0.01; ***P < 0.001. n = 6. (E) Adipose tissue was stained with H&E, and adipocyte surface area was quantified. Scale bars: 100 μm. n = 3. (F) Adipogenic gene expression in WAT (WT, n = 5; GSNOR–/–, n = 4). Statistical significance was determined by 2-way ANOVA and presented as mean ± SEM. **P < 0.01, compared with WT, analyzed by Bonferroni’s multiple comparison test. Statistical significance between 2 groups was determined by unpaired Student’s t test (2-tailed) and presented as mean ± SEM.

