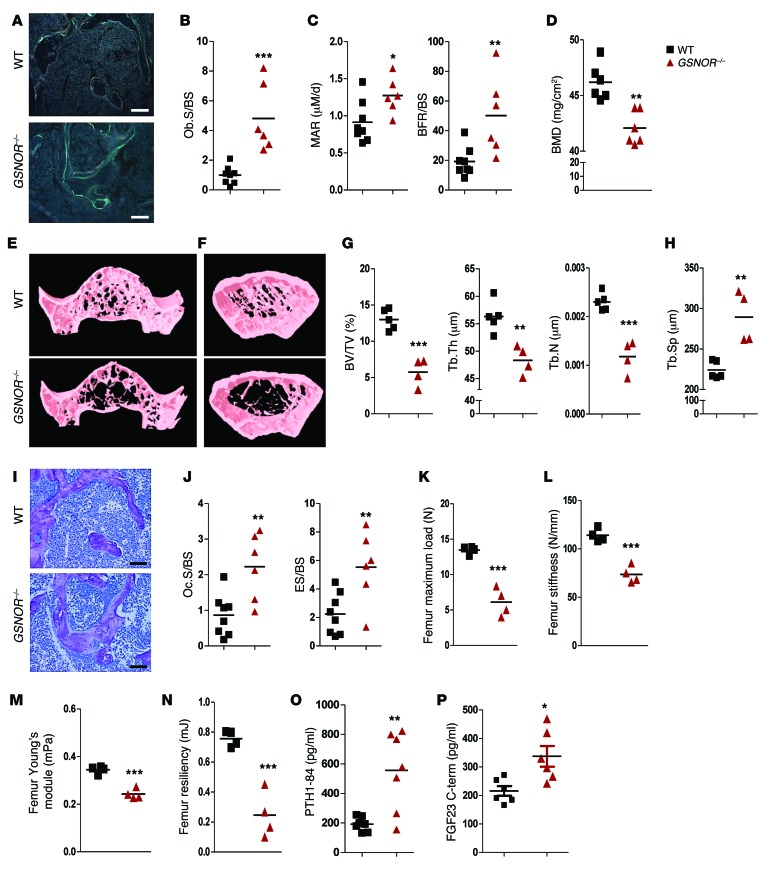
Figure 4. GSNOR–/– mice have enhanced bone formation and resorption.
All studies were conducted in 2-month-old male WT and GSNOR–/– mice. (A) Calcein double labeling of the distal femur; mineralization front was stained in green. Scale bars: 200 μm. n = 3. (B and C) Quantification of histomorphometric analysis of Ob.S/BS (B) and MAR and BFR/BS (C) in the femur (WT, n = 8; GSNOR–/–, n = 6). (D) Whole-body BMD. n = 6. (E and F) Representative images of the vertebra (E) and femur (F). n = 3. (G and H) Quantification of μCT analysis of BV/TV, Tb.Th, Tb.N (G), and Tb.Sp (H) (WT, n = 5; GSNOR–/–, n = 4). (I) Toluidine blue staining of the distal femur, the mineralized bone was stained red. Scale bars: 200 μm. n = 3. (J) Quantification of histomorphometric analysis of osteoclast content in the femur (WT, n = 8; GSNOR–/–, n = 6). (K–N) Femur maximum load (K), stiffness (L), Young’s module (M), and resiliency (N). n = 4. (O) PTH level in the serum. n = 7. (P) Serum FGF23 level. C-term, C-terminus. n = 6. * P <0.05; **P < 0.01; ***P < 0.001. Statistical significance between 2 groups was determined by unpaired Student’s t test (2-tailed) and presented as mean ± SEM.

