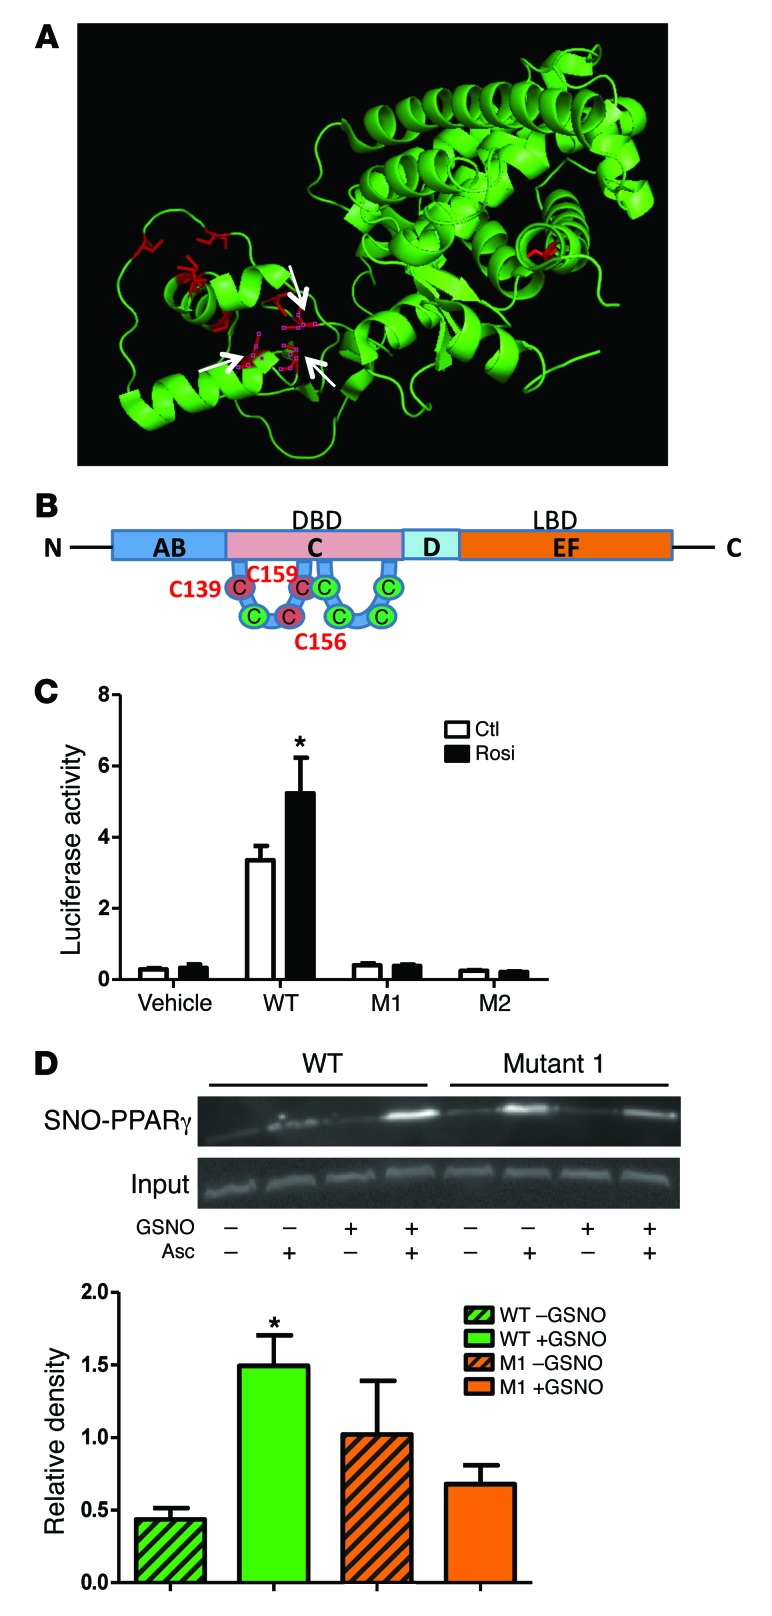
Figure 6. Identification of Cys 139 as a site of PPARγ S-nitrosylation.
(A) A 3D structure of PPARγ showed the 10 cysteines in red, with white arrows labeling the 3 mutated ones. The 3D structure was derived from ref. 50. (B) A topology map of PPARγ with 3 mutated cysteines in red. DBD, DNA-binding domain; LBD, ligand-binding domain. (C) PPARγ luciferase activity in HEK-293T cells overexpressed with WT and mutants, in the presence or absence of the PPARγ agonist rosiglitazone (1 μM). *P < 0.05, compared with WT CTL, analyzed by Bonferroni’s multiple comparison test (2-way ANOVA). n = 4. (D) SNO-PPARγ in HEK-293T cells overexpressed with WT and mutant 1 (Cys 139), measured by SNO-RAC. Omission of ascorbic acid was used as a negative control. *P < 0.05, compared with WT without GSNO treatment, analyzed by Bonferroni’s multiple comparison test (2-way ANOVA). n = 3. Data are presented as mean ± SEM.

